This is an archive of the Drupal Association blog posts. For recent posts, see our new blog.
By holly.ross.drupal on
 I've had a couple of questions related to Association finances lately in various communications channels. I know that most of you are not finance professionals for a living, so rather than answering in several different silos, I thought I might write up this post about how the Association financials are structured and how you can read them. You know, for when you need a break from your other Drupal work! So if you're into this sort of thing (and I am not judging here, because I am WAY INTO this sort of thing), read on!
What are financial statements?
A financial statement is a formal record of the financial activities of the Drupal Association. The financial statements present information in a structured way that should make it easy to understand what is happening with the organization's finances. In other words, financial statements should tell a story about what is happening with the Association's money. Generally, financial statements include three standard reports:
- Income Statement (or Profit & Loss): This report shows the revenue that is recognized as received and spent during a given period. It is tempting to compare the income statement to your checkbook register, but it's not quite that simple. The catch is that the income statement shows RECOGNIZED income and expense. One of the US accounting rules, for example, is that we can not recognize revenue for a DrupalCon ticket until the month in which the event happens. So, if you buy your DrupalCon Barcelona ticket in June, and the event is in September, your ticket revenue will not show up until our September income statement. Until then, that revenue sits on our Balance Sheet. So, the income statement alone does not give you a full picture of the organiztion's financial position. It simply represents the movement of recognized revenue in a specific time period. The income statement also represents some non-cash changes, such as depreciation.
- Balance Sheet: The balance sheet shows us the assets and liabilities for the organization for that given time period. Reading the balance sheet, you can get a better understanding of how much money is in the bank, and where we owe, or might possibly owe, money. These things are not reflected in the income statement. Going back to our DrupalCon Barcelona example, prior to the Con, any revenue from sponsorship, ticket sales, or training sales would be held on the balance sheet in two ways. First, it will simply be reflected as cash in our bank account. Secondly, it is reflected as a liability, broken out specifically as sponsorship or ticket revenue. It's a liability because if we cancel the Con, we have to give you your money back! When preparing the September financials, we move the ticket revenue from the balance sheet liabilities session to the Income Statement, where it is treated as recognized revenue.
- Cash Summary: The cash summary (or cash flow) is the report that simply shows the movement of money into and out of our accounts. It does not account for depreciation or other non-cash accounting.
Those three reports are the standard set that organizations issue when reporting their financials. The Association, however, issues additional reports to add clarity and transparency around the programs that you care most about.
About the Drupal Association Financial Statements
The Drupal Association financials are created on a monthly basis, and then are reviewed by the Finance Comittee of the board. On a quarterly basis, the Finance Committee presents the financials to the Board in executive session, which, if there are no serious questions, approves the financials. At that point, we publish the three months of financials to the community. They are promoted in a blog post about the meeting, and are also always available on the board materials page on the Association site.
As I mentioned above, the Association financial statements go above and beyond the standard reports. In addition to the main three, our monthly financials also include the following:
- "PL All Classes:" This is an income statement report, showing recognized revenue and expenses for the month, but it is broken out by program area. This gives you the opportunity to see, for that month, the recognized revenue and expense for the upcoming Cons, or Drupal.org, or our Drupal Product Marketing efforts, for example. This report is for the month only, so keep that in mind. If you are looking at the May financial statements, the numbers in this report are for May only.
- "Revenue:" This report was designed to show how our various revenue lines are performing. One of our board mandates is to diversify revenue so that DrupalCons are not our primary source of income. Taking this pressure off the Cons to perform financially will allow us to make different kinds of choices for the Cons, and it provides us more stability as an organization. This report helps us monitor progress for those revenue lines.
- "PL DC ConName:" We create one of these report for each of the Cons we are working on. They are income statements for those Cons, year to date (YTD). YTD means that the report reflects all income and expense for that year, not just the current month. In these reports, you can see detailed information about expenses, with revenue generally not recognized on the report until the month of the Con.
And, keep in mind that all Association financial statements are reported in US Dollars.
How to Read the Financial Statements
A goal of financial statements is that they are supposed to make financial information easier to understand. However, the truth is that it is difficult for mere mortals to read financial statements. It takes both training and practice. However, let's see if I can walk you through some details. I'll use the March 2014 financial statements in this example.
Income Statement
The Income Statement presents the income and expenses for both the month of the report (in this case, March) as well as the year to date, or YTD, amounts (in this case, 1 January through 31 March 2014). So the top of the report looks like this:

Here's what what the columns represent:
- Actual: Amounts for the month the financials report represents. In this case, March 2014.
- Budget: The budgeted amount for the month the financial report represents. In this case, the amount we budgeted for March 2014.
- YTD Actual: Total amount for the year, through the month the financial report represents. In this case, 1 January through 31 March 2014.
- YTD Budget: Total budgeted amount for the year, through the month the financial report represents. In this case, the amount we budgeted for 1 January through 31 March 2014.
- Var %: The percent difference between the YTD Actual and YTD Budget. This gives you a sense of how good a job we did at budgeting. Variance can occur because we receieved or spent money faster than we anticipated, or our models were off entirely. Remember that the Association only began budgeting and reporting in these formats 18 months ago, so we're still learning about what our cycles of revenue and expense are, so we expect the variance to decrease overall throughout the next few years as we get better at this.
Balance Sheet
The Balance Sheet presents the assets and liabilities as of the month of the report, which is March 2014 in this example. The balance sheet almost always also shows a comparative period - the same period the year prior, which is March 2013 for this example. This gives you the opportunity to see how things have changed in the last year. The report looks like this:

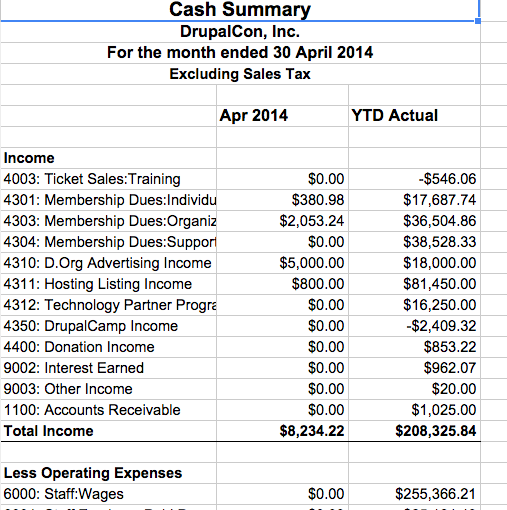
Cash Summary
The Cash Summary report shows the flow of money into and out of the organization in the given period. For compartive purposes, it also includes a Year to Date (YTD) column that shows all cash movement for the year, which is 1 January through 31 March in this example. The Cash Summary looks like this:
What our Financial Statements do not show
Simply put, our financial statements do not show a lot of information. The point of statements is to take complex and copious amounts of data and distill it into something digestable. We do not, for example, show each of the tickets sold for a DrupalCon and who they were sold to. We don't show each invoice that was received for Association software as a service subscriptions. We have the data, and I'm not oppposed to sharing it (as long as I check that we are not violating any privacy or other laws - you never know). However, it does not make sense for us to publish this level of detail on a monthly basis.
That said, if there is something our financial statements do not show you, you can always ask. If it's not published here, it's not because we don't want to share the information. It's because we want to share information that can be meaningfully understood.
Summary
That should help you get through some of our financial statements a little better. I am not an accountant, but I am always happy to field any questions you have about these documents, and our amazing Operation Team of Kris and Leslie love to help. Just drop me a line via email or go ahead and post in a public channel like Twitter or a forum. Give me a heads up and I will get back to you.
Flickr photo: Doug88888